In 2003, Bain & Company introduced a single question that transformed how businesses measure customer loyalty. Two decades later, that same methodology has become the gold standard for measuring something equally critical: whether your employees would recommend your company as a place to work.
Employee Net Promoter Score (eNPS) distills workforce sentiment into a single number that predicts turnover, correlates with productivity, and serves as an early warning system for engagement problems. According to Gallup research, companies in the top quartile of employee engagement see 81% lower absenteeism and up to 43% less turnover—metrics that eNPS helps track.
Yet most organizations measure eNPS incorrectly, survey too frequently, or fail to act on results. This guide covers everything you need to implement eNPS effectively: the calculation, industry benchmarks, survey design, follow-up strategies, and the common mistakes that make eNPS programs ineffective.
What Is Employee Net Promoter Score (eNPS)?
Employee Net Promoter Score measures workforce loyalty and advocacy through a single question:
“On a scale of 0 to 10, how likely are you to recommend [Company] as a place to work to friends or family?”
The methodology adapts the customer-focused Net Promoter Score—used by two-thirds of Fortune 1000 companies—to measure internal sentiment. The premise is straightforward: employees who would actively recommend your organization are engaged; those who wouldn’t may be flight risks.
Why eNPS Matters: The Business Case
The connection between employee advocacy and business outcomes is well-documented:
Sources: Gallup, AIHR, QuestionPro Research
The insight driving eNPS adoption is simple: employees who would recommend your company are invested in its success. They stay longer, perform better, and create better customer experiences. Apple was among the first to recognize this connection—understanding that “employees who are promoters themselves are more likely to influence customers to become promoters.”
How to Calculate eNPS
The formula mirrors customer NPS:
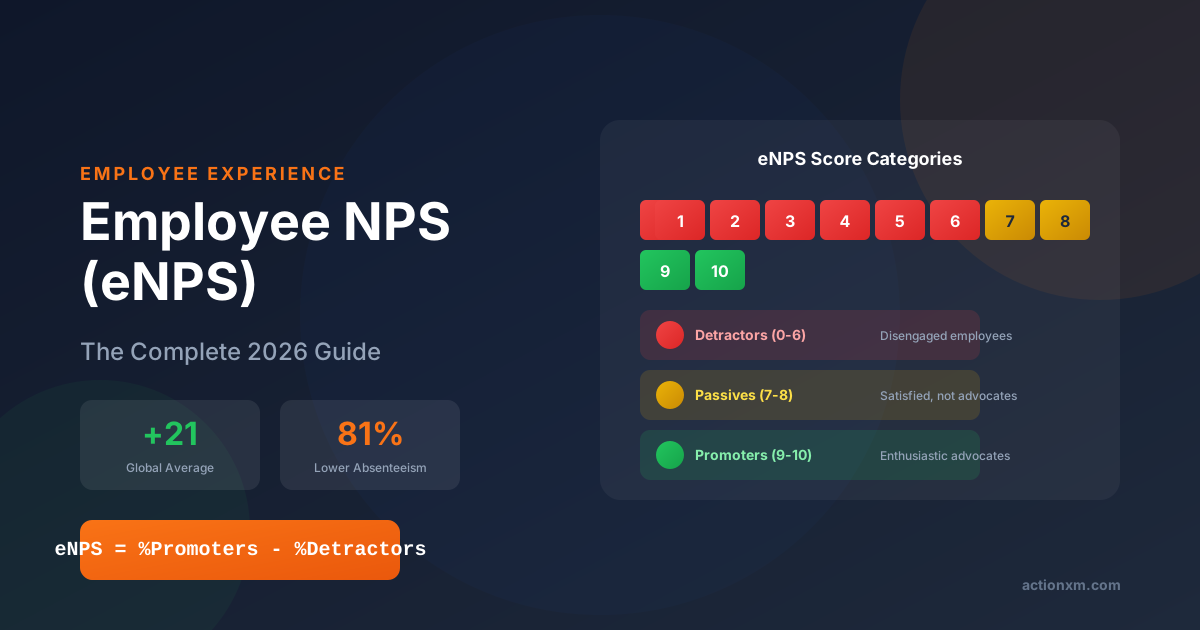
eNPS = % Promoters − % Detractors
Passives (7-8 scores) are counted in your total respondents but don’t affect the calculation—they’re neither helping nor hurting your score.
Step-by-Step Calculation Example
Let’s walk through a real calculation with 200 employee responses:
What Is a Good eNPS Score?
Unlike customer NPS where scores of 50+ are considered excellent, employee NPS benchmarks tend to be lower. Here’s how to interpret your score:
Key Benchmarks to Remember
According to QuestionPro 2025 research and Culture Amp data:
- Global Average: 21-27 depending on methodology
- Culture Amp Median: 17 across global organizations
- Top Performers: Companies like Zoom (94), HubSpot (74), and Adobe (57)
The key insight: trend matters more than absolute score. A company improving from 5 to 15 is in better shape than one declining from 40 to 30.
eNPS Benchmarks by Industry (2025-2026)
Industry context is essential for interpreting your score. A +20 in healthcare represents strong performance; in technology, it’s below average.
Company Size Impact
Smaller organizations consistently outperform larger enterprises on eNPS—likely reflecting more connected, personal work environments.
How to Implement eNPS Effectively
Survey Frequency: The Quarterly Sweet Spot
Most organizations should measure eNPS quarterly—frequent enough to track trends, infrequent enough to avoid survey fatigue.
Timing considerations:
- Give employees at least one week to complete the survey
- Avoid fiscal year-end, holiday periods, or active restructuring
- Survey mid-week (Tuesday-Thursday) for better response rates
- Maintain consistent timing quarter-over-quarter
Anonymous vs. Attributed Surveys
Strong recommendation: Keep surveys anonymous.
Anonymity is essential for honest, unbiased feedback. Employees need to feel safe providing candid responses—especially detractors who have the most valuable insights about organizational problems.
If you must identify respondents (for small teams or follow-up purposes), consider third-party platforms that aggregate results before sharing with managers, or clearly communicate that individual responses won’t affect performance reviews.
Essential eNPS Follow-Up Questions
A score without context is only half useful. The follow-up question reveals the “why” behind the number.
The Required Follow-Up
Always include this question:
“What is the primary reason for your score?”
This open-ended response provides the qualitative insight that makes eNPS actionable. Without it, you know employee sentiment but not what’s driving it.
Segment-Specific Follow-Up Questions
- "What do you love most about working at our company?"
- "What should we never change about our workplace?"
- "What makes you proud to work here?"
- "What aspects of our culture would you highlight to a friend?"
- "What would it take to move your score to a 9 or 10?"
- "What's holding you back from recommending us more enthusiastically?"
- "What one change would make this a better place to work?"
- "What concerns would you mention if asked about working here?"
- "What challenges are you facing that we should address?"
- "What changes would most improve your day-to-day experience?"
- "What specific factors influenced your rating?"
- "What would need to change for you to recommend us?"
Additional Optional Questions
If you want slightly more depth without causing survey fatigue, consider adding one of these:
- “How would you rate career growth opportunities here?” (1-5 scale)
- “Do you feel your manager supports your development?” (Yes/No)
- “What is the single biggest thing we could improve?”
- “Would you still be working here in 2 years?” (Yes/Maybe/No)
Warning: Keep total survey length under 3 minutes. Longer surveys see completion rates drop from 63% to 37%.
eNPS vs. Traditional Engagement Surveys
eNPS isn’t meant to replace comprehensive engagement measurement—it’s a complement that fills different needs.
The Combined Approach
Leading organizations use both:
- Annual engagement survey: Establishes baseline, identifies improvement areas in detail
- Quarterly eNPS: Tracks trends, monitors sentiment changes between surveys
- Pulse surveys: Address specific topics as needed (optional)
This layered approach balances depth with frequency, giving you both strategic insight and real-time pulse data.
Common eNPS Mistakes (and How to Avoid Them)
From Score to Action: The eNPS Response Framework
Measuring eNPS without acting on it is worse than not measuring at all. Here’s how to turn scores into improvements.
eNPS and the Employee Lifecycle
Research from Effectory reveals an important pattern: 86% of new employees (working less than a year) would recommend their employers. After five years, this drops to 70%.
This pattern suggests specific measurement strategies:
For new hires: Survey at 30, 60, and 90-day milestones to catch early warning signs before the honeymoon period ends.
For long-tenured employees: Pay special attention to declining scores among veterans. They have institutional knowledge and often influence newer colleagues.
At key moments: Measure eNPS after major events—reorganizations, leadership changes, policy updates—to catch impact quickly.
Frequently Asked Questions
How is eNPS different from NPS?
eNPS uses the same methodology as customer NPS but focuses internally: “Would you recommend this company as a place to work?” versus “Would you recommend this company to others?” The calculation is identical, but benchmarks are typically lower because employees have deeper, more complex relationships with their workplace than customers have with brands.
What’s considered a “good” eNPS score?
A score above +10 is generally considered good, above +30 is strong, and above +50 is excellent. However, context matters: industry benchmarks, company size, and regional culture all affect interpretation. The most important benchmark is your own trajectory over time.
How often should I measure eNPS?
Quarterly is the recommended frequency for most organizations. This balances trend visibility with survey fatigue prevention. More frequent measurement risks response quality degradation; less frequent measurement misses important shifts.
Should eNPS surveys be anonymous?
Yes—anonymity is essential for honest feedback. Employees need to feel safe providing candid responses, especially those who are disengaged. If you need department-level insights, aggregate responses to preserve anonymity while enabling segmentation.
How many follow-up questions should I include?
One required follow-up (“What is the primary reason for your score?”) plus optionally one additional question. Keep total survey time under 3 minutes. Longer surveys see 40% drops in completion rates.
Can I compare eNPS across different offices or countries?
Be cautious. Cultural response patterns vary significantly—East Asian cultures rarely give extreme scores, while Latin American respondents tend toward enthusiasm. Compare trends within regions rather than absolute scores across them.
What should I do with a negative eNPS score?
A negative score indicates more detractors than promoters—a serious warning sign. Prioritize analysis of open-ended feedback to identify root causes, communicate transparently with employees about findings and planned actions, and set a 90-day goal for measurable improvement.
Does eNPS predict turnover?
Research shows correlation: employees scoring 9-10 rarely leave voluntarily, while detractors (0-6) are significantly more likely to churn. However, eNPS is a leading indicator, not a guarantee. Use it alongside other retention signals.
The Bottom Line
Employee NPS offers something rare in HR measurement: a single, standardized metric that tracks over time, benchmarks against industry, and correlates with business outcomes. Its simplicity is its strength—anyone in the organization can understand what a +25 or a -10 means.
But simplicity is also its limitation. eNPS reveals advocacy levels, not root causes. It tells you that there’s a problem, not what to fix. The organizations that get the most value from eNPS pair it with:
- Follow-up questions that provide context
- Quarterly measurement cadence that enables trend tracking
- Transparent communication of results
- Visible action on feedback
- Annual engagement surveys for deeper diagnostic insight
The companies seeing real impact don’t treat eNPS as a vanity metric to report to the board. They treat it as an early warning system that triggers investigation, conversation, and action.
The question isn’t whether to measure employee loyalty. It’s whether you’re prepared to do something with what you learn.
Measure and Improve Employee Loyalty with ActionXM
ActionXM combines eNPS with comprehensive engagement measurement in a single platform. AI-powered text analytics automatically theme open-ended feedback, while role-based dashboards ensure managers see the insights most relevant to their teams.
Ready to transform employee feedback into action?
Questions about implementing eNPS at your organization? Contact us for a personalized consultation.
Sources
- AIHR - Employee Net Promoter Score (eNPS): 2026 Ultimate Guide
- Gallup - How to Improve Employee Engagement
- QuestionPro - eNPS Scores for Top Companies: 2025 Industry Leaders & Trends
- Culture Amp - Employee Net Promoter Score Guide
- Bain & Company - The History of Net Promoter
- Leapsome - eNPS: What Employee Net Promoter Score Is & Why It Matters
- Perceptyx - How to Measure and Improve Employee Net Promoter Score
- Honestly - Employee Net Promoter Score: A Complete 2024 Guide
- Effectory - Employee Lifecycle Research
- Hive HR - eNPS Benchmarks Q3 2024
- BambooHR - Employee Net Promoter Score
- Matter - What is eNPS? 2026 Guide with Questions & Benchmarks
- ThriveSparrow - How to Calculate Employee Net Promoter Score